Understanding Hyperliquid Liquidation Data
Deep dive into Hyperliquid liquidation mechanics and how to use liquidation data for better trading decisions with HyperX market intelligence tools.
What Are Liquidations?
In leveraged trading, a liquidation occurs when a trader's position is forcibly closed because the losses on that position have eroded the margin (collateral) below a critical threshold. Liquidations are the mechanism that ensures the exchange remains solvent — when a trader cannot cover their losses, the exchange's liquidation engine steps in to close the position before the losses exceed the deposited collateral.
Understanding liquidations is essential for any perpetual futures trader. Liquidations are not random events — they cluster at predictable price levels, create cascading market effects, and provide actionable intelligence for informed traders. On Hyperliquid, all liquidation data is on-chain and publicly accessible, making it a uniquely transparent venue for liquidation analysis.
How Liquidations Work on Hyperliquid
Maintenance Margin
On Hyperliquid, each position has a maintenance margin requirement — the minimum amount of collateral that must be maintained relative to the position size. When the unrealized loss on a position reduces the account's margin below this maintenance level, the position becomes eligible for liquidation.
The maintenance margin rate varies by asset and position size. For example, a BTC perpetual position might have a maintenance margin requirement of 0.5% for smaller positions, increasing for larger positions to manage systemic risk. The exact rates are defined by Hyperliquid's risk engine and are publicly documented.
The Liquidation Engine
When a position falls below the maintenance margin threshold, Hyperliquid's on-chain liquidation engine takes over:
- Detection — The system continuously monitors all open positions against their maintenance margin requirements
- Liquidation Order — A market order is submitted to close the underwater position
- Execution — The liquidation order executes against the order book at the best available price
- Insurance Fund — If the liquidation results in a loss beyond the trader's collateral (known as "bad debt"), the insurance fund covers the shortfall
Unlike centralized exchanges where the liquidation process is opaque, Hyperliquid's on-chain liquidation engine means every liquidation event is publicly verifiable. You can see exactly when liquidations occur, at what price, for what size, and on which asset.
Liquidation Price Calculation
A position's liquidation price depends on several factors:
- Entry price — The average price at which the position was opened
- Position size — Larger positions have higher margin requirements
- Leverage — Higher leverage means the liquidation price is closer to the entry price
- Available margin — Additional collateral in the account can buffer against liquidation
- Funding payments — Accumulated funding payments affect the effective margin
For a long position, the liquidation price is below the entry price. For a short position, it is above. The distance between the entry price and liquidation price is inversely proportional to the leverage used.
Example: If a trader opens a long BTC position at $50,000 with 10x leverage and a 0.5% maintenance margin, their liquidation price is approximately $45,250 — roughly 9.5% below their entry. With 50x leverage, the liquidation price narrows to approximately $49,100 — just 1.8% below entry.
Reading Liquidation Data
Liquidation Volume
Liquidation volume measures the total dollar value of positions liquidated over a given period. High liquidation volume indicates:
- Market stress — Large numbers of traders are being forced out of their positions
- Excess leverage — The market was over-leveraged in one direction
- Potential reversal points — After significant liquidation volume, the forced selling or buying is exhausted, often creating a short-term reversal
HyperX displays liquidation volume broken down by asset, timeframe, and direction (long liquidations vs. short liquidations). This allows you to quickly assess which assets are experiencing the most stress and in which direction.
Liquidation Price Levels
Not all price levels are equally likely to trigger liquidations. By analyzing open positions and their leverage levels, you can estimate where liquidation clusters exist:
- High leverage longs below current price — These create pools of potential sell pressure if the price drops
- High leverage shorts above current price — These create pools of potential buy pressure if the price rises
- Dense clusters — Price levels where many liquidation prices converge represent zones of significant potential market impact
Understanding these clusters helps you anticipate where cascading liquidations might occur and where the market might find support or resistance due to liquidation-driven order flow.
Long vs. Short Liquidation Ratio
The ratio of long liquidations to short liquidations reveals market positioning bias:
- Predominantly long liquidations — Indicates the market was over-leveraged long, and a price drop is flushing out bullish positions. This can signal capitulation and a potential bottom.
- Predominantly short liquidations — Indicates the market was over-leveraged short, and a price rise is squeezing bearish positions. This can signal a short squeeze that may extend further.
- Balanced liquidations — Suggests no strong directional bias in liquidations, typically seen during ranging or choppy markets.
Cascading Liquidations
One of the most powerful and dangerous phenomena in leveraged markets is cascading liquidations. This occurs when an initial price movement triggers liquidations, and those liquidation orders push the price further in the same direction, triggering additional liquidations.
How Cascading Liquidations Develop
- A moderate price decline occurs, triggering the most highly leveraged long positions to be liquidated
- The liquidation of these longs creates sell orders that push the price down further
- The additional price decline triggers the next tier of leveraged longs to be liquidated
- This cycle repeats, creating a waterfall effect where the price drops rapidly through multiple liquidation clusters
- The cascade typically ends when either: the liquidation clusters are exhausted, or counter-trend buyers absorb the selling pressure
Cascading liquidations explain why crypto markets sometimes experience sharp, sudden moves of 10-20% in a matter of minutes. They are not caused by a single large seller, but by a chain reaction of forced selling.
Identifying Cascade Risk
You can assess cascade risk by examining:
- Open interest relative to market depth — High open interest combined with thin order books creates conditions for cascading liquidations
- Leverage distribution — When a large percentage of open positions use high leverage (20x+), the market is fragile
- Liquidation cluster density — Tight clusters of liquidation prices create "trip wires" that can trigger rapid cascading effects
- Funding rates — Extremely high positive funding rates indicate crowded long positioning, suggesting potential for a long liquidation cascade
Practical Trading Applications
Liquidation Maps as Support and Resistance
Liquidation clusters function as dynamic support and resistance levels. When price approaches a zone with significant long liquidations below it, the market may find temporary support as those liquidations create absorption (buyers stepping in front of the forced selling). Conversely, if price breaks through a liquidation cluster, the forced selling accelerates the move.
HyperX provides liquidation maps that visualize where liquidation clusters exist relative to the current price. These maps are updated continuously as traders open and close positions, providing a real-time view of market fragility.
Timing Entries After Liquidation Events
Major liquidation events often create opportunities for counter-trend entries. After a significant long liquidation cascade, the forced selling is exhausted, leveraged longs have been flushed out, and the market often rebounds. Similarly, after a short squeeze that liquidates many short positions, the forced buying subsides and price may retrace.
Key signals for timing these entries:
- Liquidation volume spike followed by rapid volume decline — suggests the cascade is ending
- Funding rate normalization — extremely skewed funding returning to neutral after a liquidation event signals positioning reset
- Open interest decline — a sharp drop in open interest confirms that leveraged positions have been liquidated, reducing the overhang
Position Sizing Based on Liquidation Risk
Understanding your own position's proximity to liquidation clusters helps you size positions appropriately:
- If your liquidation price falls within a dense cluster of other liquidation prices, a cascading event could liquidate your position even if the fundamental move against you is small
- Place your liquidation price outside major clusters to reduce the risk of being caught in a cascade
- Use the liquidation map to identify "safe zones" where your position can withstand normal market volatility without being swept up in a cascade event
Identifying Market Manipulation
Large traders sometimes deliberately push prices through liquidation clusters to trigger cascading liquidations, then reverse their position to profit from the subsequent bounce. This is sometimes called "liquidation hunting" or "stop hunting." Signs of this behavior include:
- Sharp price moves on unusually low organic volume
- Price piercing through a known liquidation cluster and immediately reversing
- Large limit orders placed just below or above liquidation clusters, ready to be filled by the forced liquidation orders
Understanding where liquidation clusters exist helps you recognize when these tactics may be at play and avoid being on the wrong side of them.
How HyperX Visualizes Liquidation Data
HyperX provides several tools for liquidation analysis:
Liquidation Feed
A real-time feed of liquidation events across all Hyperliquid markets. Each event shows the asset, direction (long or short), size, price, and timestamp. You can filter by asset, minimum size, and direction to focus on the liquidations most relevant to your trading.
Liquidation Volume Charts
Historical charts showing liquidation volume over time, broken down by long and short. These charts help you identify periods of market stress and correlate liquidation events with price action.
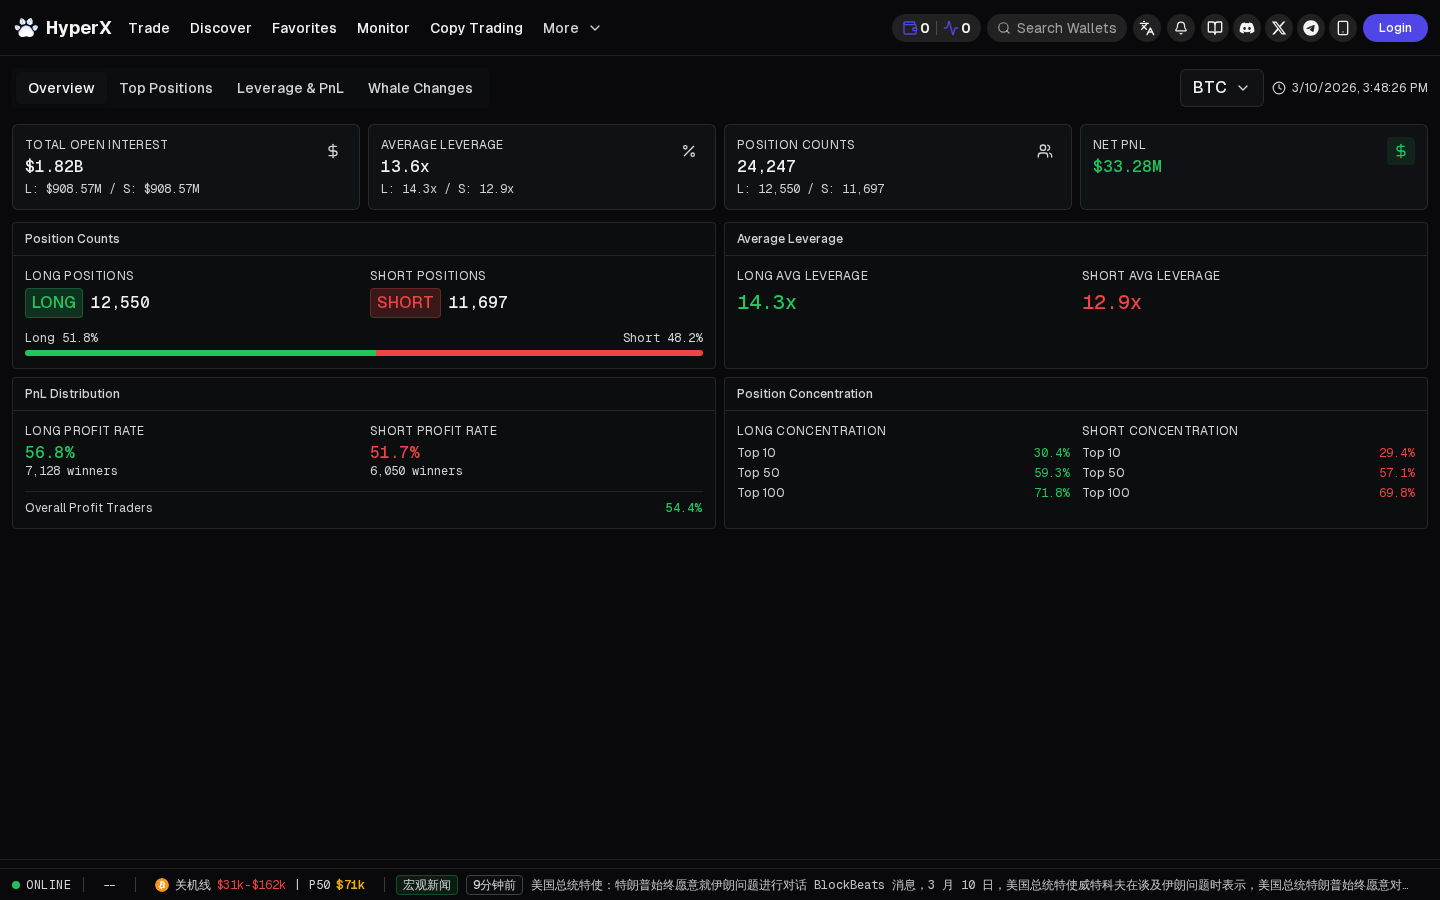
Market Overview Dashboard
The HyperX market analysis section integrates liquidation data with other market intelligence including open interest, funding rates, and volume. This combined view provides comprehensive situational awareness of market conditions.
Frequently Asked Questions
What is the difference between a liquidation and a stop-loss? A stop-loss is a voluntary order placed by the trader to limit losses at a predetermined price. A liquidation is an involuntary forced closure by the exchange when the trader's margin falls below the maintenance requirement. Stop-losses give you control over your exit price, while liquidations often execute at the worst possible price during volatile conditions.
Can I avoid being liquidated? Yes. Use lower leverage, maintain additional margin in your account, and set stop-losses well above your liquidation price. A general best practice is to never let a trade get close to your liquidation price — if your stop-loss has been hit, you should already be out of the position.
Do liquidations affect all traders? Directly, liquidations only affect the trader being liquidated. However, the market orders generated by liquidations impact the order book and can move prices, indirectly affecting all market participants. Large liquidation events can cause significant price movements that trigger additional liquidations across the market.
How can I see upcoming liquidation risk in real time? HyperX's market analysis tools show current open interest, leverage distribution, and liquidation cluster estimates. By monitoring these metrics, you can assess the current level of liquidation risk in the market and adjust your own positioning accordingly.
Why do liquidation cascades happen more in crypto than traditional markets? Crypto markets typically offer much higher leverage (up to 50x or more), operate 24/7 without circuit breakers, and have lower overall liquidity compared to traditional markets. These factors combine to make cascading liquidations more frequent and severe. Hyperliquid's transparency at least allows traders to monitor these conditions in real time, which is not possible on many centralized exchanges.